|
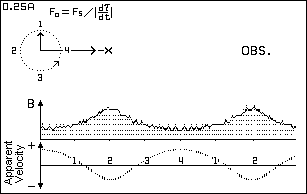
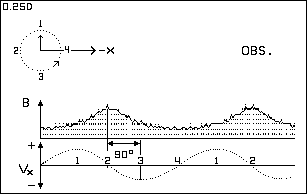
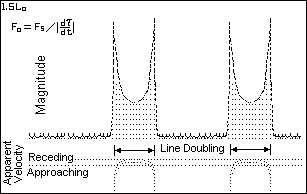
A Ritzian Interpretation of Variable Stars1 - 2 - 3 - 4See Figure 12 for a Crab Pulsar-like light curve. Figures 4 and 5 show a comparison of time-modulation versus Doppler induced apparent radial velocity effects. Note that the Doppler version has the same 90 degree phase error as produced by Serbulenko's computations as seen in Figure 1. |

|

|
|
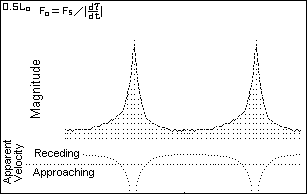
The apparent velocity curves are based on the relation:
|
|
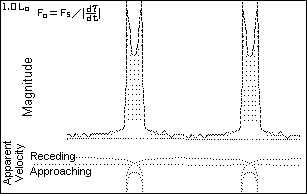
When dτ/dt approaches zero, the apparent radial velocity
approaches infinity. The infinite peaks do not match any intrinsic
stellar physical process. (Physical objects simply do not attain infinite
speeds of expansion or contraction.) The velocity curve shows
line-doubling in the saddle region which is caused by the
radial velocity information time-wise looping back on itself.
(Appearances can be deceiving!)
|
|
The light curve of Figure 10 bears a resemblance to that for the
Geminga repeating gamma ray burster. (The computer program was
run at eccentricity of 0.0 for this figure.) See
Modeling the Geminga Gamma-ray Pulsar (Under construction)
for a family of curves for eccentricity = 0.2 with different perihelion
angles.
|
| Figure 12 comes from the computer simulation for a binary star with both components visible. The component which produces the the interpulse (IP) has a semi-orbital diameter of 1.2 times that of the main component. Its lower amplitude orbital accelerations produces the broader, lower amplitude peak. The general shape of the light curve for this computed binary is similar to that for the optical light curve for the Crab pulsar shown in figure 13. |
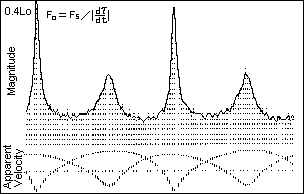
Figure 12. Lo = 0.4 L - Time Modulation |
|
Figure 13 shows an optical light curve for the Crab Pulsar. These pulses may be
due to synchrotron radiation produced by a spinning neutron star combined with the
lighthouse effect. If so, both peaks should show evidence of a common spectral origin.
If the individual pulse spectra suggest two different sources then high speed -
high resolution spectroscopy will be needed to provide us additional clues about the nature
of this object.
In a 2008 study, T. H. Hankins and J. A. Eilek(6) report finding that the Crab Pulsar's interpulses (IPs) do in fact present a band of emission lines that are not seen in the main pulses (MPs). [Added 26 Jul 2012.] |
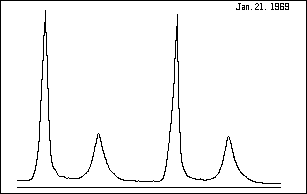
Figure 13. Crab Pulsar - NP 0532 After R. Lynds, Jan 21, 1969 |
|
The menu-driven computer program d-Cephei can be run online. Click on
bas/d-Cephei.exe. [Added 4 June 2004.]
For the high repetition rates of pulsars we need to concern ourselves with the masses and orbital radii for stellar systems that could be considered as binary star source candidates. A pair of neutron stars, each having mass on the order of 1.4 solar masses, traveling in approximately circular orbits of radius 110 kilometers, would have orbital speeds on the order of 0.07 c and orbital frequencies of about 30 orbits per second. [Revised 30 Oct 2011.] The above information was originally given as orbit radius = 200 km (17 "Houstons" based on the idea that a neutron star was "one Houston" in diameter; and the orbital speed = 0.014 c. The shape of the light curve(s) for the Crab pulsar suggests an extinction distance equal to one half the de Sitter overtaking distance L, as calculated using equation 4.
Here T would be equal to one half of the 35 msec orbital period or 17.5 msec. We get L=187,000 km. Half of this is 93,000 km which is about one fourth of the average earth-moon distance. Using T = 16.5 msec (33 msec/2), v= 0.07 c, gives L = 35,000 km. Half of that distance, 17,500 km, is about five percent of the earth-moon distance. [Added 31 Oct 2011.] The article by Massaro, et. al., titled A two component model of the Crab pulsar emission based on the BeppoSAX pulse profiles(7) concludes "We have shown that the pulse shape change of [the] Crab Pulsar in the X and low-energy Gamma rays can be explained by means of a two component model. These two components must have substantially different energy spectra and phase distributions." The authors suggest that a second emission region in the neutron star's magnetosphere adds to the total energy of the X-ray and low-energy Gamma ray spectrum of the interpulse bridge and the secondary pulse. They do not address the possibility that a binary star might serve as an alternative two component model. If the Ritz hypothesis is valid then we should expect to find lots of two-color, double pulsed, pulsars. AN Ursae Majoris, which is considered to be a possible slow pulsar (8), (period 1.914 hr) may be a candidate as a two-color pulsar. This object does have two different emitting sources. Up to now, we have been considering the distance from binary to observer in terms of a given multiple of L. This can be a bit mis-leading. It may be more proper to re-define this distance as from the binary to extinction, as discussed by John Fox. Beyond this distance the light traveling to the observer will be traveling at the speed of light with respect to the dispersive interstellar medium. If the restricted Ritzian c + v hypothesis becomes validated then variable stars will provide us a tool to measure interstellar extinction distances and hence give us information about the density of interstellar matter near the sources. In a recent study titled Phase-resolved high-resolution spectrophotometry of the eclipsing polar HU Aquarii(9) Schwope et. al., employed Doppler tomography which ... gives us a test-bed for a definitive trial of the Ritzian hypothesis. Their study deals with Polars or AM Herculis cataclysmic binaries. This kind of binary system is interpreted as having no accretion disk but accomplishes star-to-star mass transfer by means of an accretion stream which terminates in the polar regions of one of the stars. Their high-resolution spectral tomographs show apparent-radial-velocity versus orbital phase for four strong emission lines. The velocity variations of the narrow emission lines NEL components, in this series, are equivalent with curves for ordinary visual or spectroscopic eclipsing binaries; i.e., their apparent radial velocity maxima and minima fall approximately 90 degrees on either side of the binary's eclipse feature. These would also be consistent with the Doppler lines in figure 5 above. |
|
There are two other periodically varying sets of emission lines in this series of
tomograms which the authors call the high-velocity component HVC
and the broad base component BBC. (These emission lines are
attributed to the hypothetical accretion stream.) The velocity curves for
these lines are approximately 80 and 90 degrees, respectively, ahead in phase
with respect to the curve for the slower moving NEL source. Segments of the
overlapping HVC+ BBC lines can be seen in the scanned-in facsimile
of the tomograph for Helium II 4686. (See figure 15.) Each of the four strong
emission line tomographs show evidence of the HVC and BBC phenomena.
The phases of the velocity curves for the HVC and BBC lines (Schwope, et. al., Figure 6) are similar to that for the Ritzian acceleration induced Doppler curve shown in Figure 4 above. I do not mean to imply that a Ritzian c+v function is at work here but rather want to stress that these kinds of spectrograms are needed in the quest of figuring out what really is going on with variable stars. |
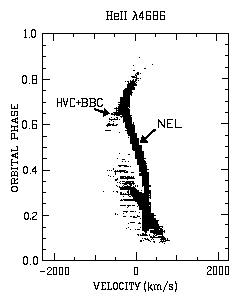
Apparent radial velocity versus orbital phase After Schwope, Mantel and Horne (1997) |
Robert Fritzius
fritzius@bellsouth.net
Top